

2021 Trade Deficit Shatters Historical Record Set Back in 2006

In December 2021, the US ran up a total trade deficit of -$80.7 billion, just a tick shy of the record -$80.8 billion set in September. The Goods Deficit increased by 3.2% to come in at -$101.4B, eclipsing the -$100B mark for the first time ever.
This capped off a year in which the trade deficit shattered the record set back in 2006.
The Net Deficit was kept in check by a surge in Net Services, which increased by 9.3% to $20.7B. YoY the Net Services is up a similar 9.1% but the Net Goods deficit is up 19.7%. The Total Net Deficit has increased by 22.7% YoY from -$65.8B in Dec 2020 to -$80.7B in Dec 2021.
This can be seen in the black line below.
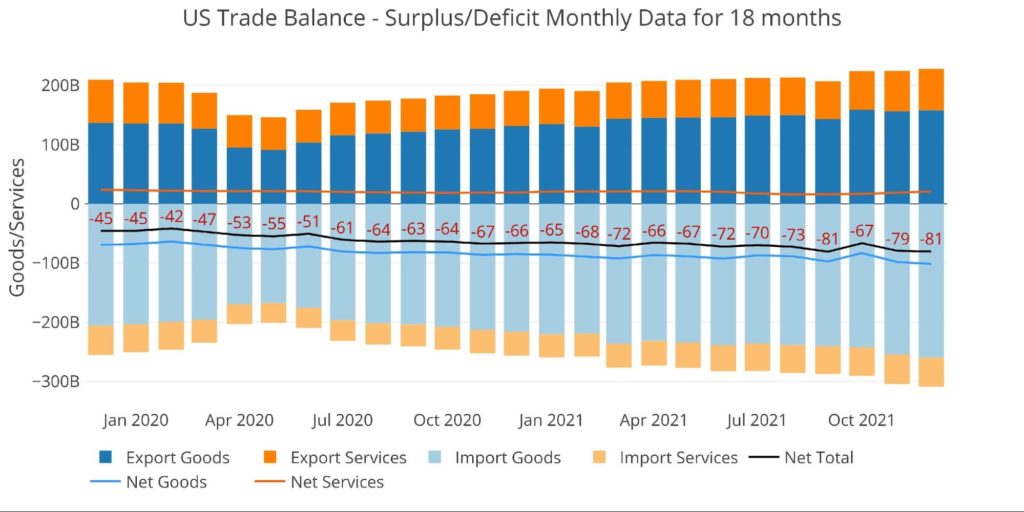
Figure: 1 Monthly Plot Detail
The YoY change can be seen in the table below.
Looking at Trailing Twelve Month:
- The Total Net Deficit of $859B is a new all-time record
- This beats the record last month of $844B by $15B
- YoY, the Net Deficit is up 27% from $676B
- The TTM Services Surplus has fallen from $285B in 2019 to $245B in 2020, and down again in 2021 to $231B
- YoY, the Services Surplus is down 5.6% and down 18.8% from 2019
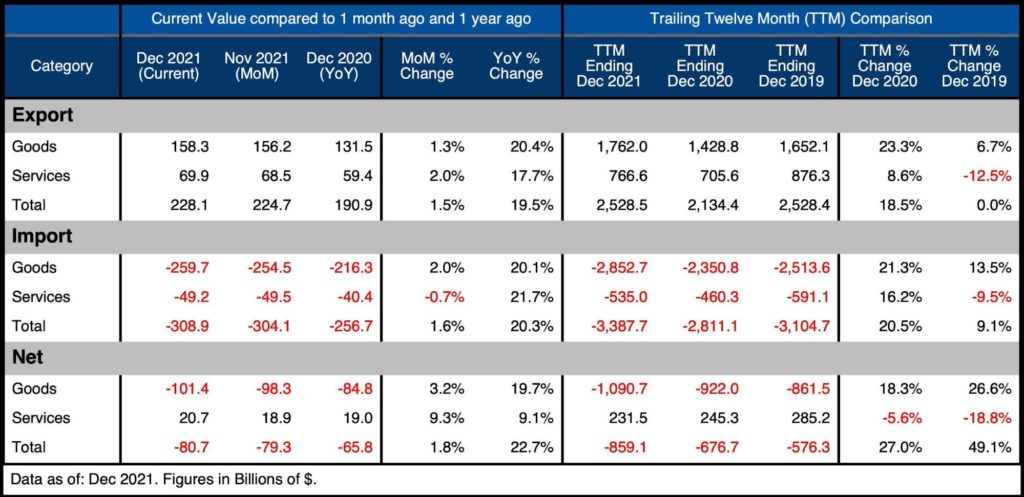
Figure: 2 Trade Balance Detail
The concerning part has been the steady increase month over month. Besides the mix-up in September and October, the deficit has climbed steadily from Jan 2020 to Dec 2021. In Jan 2020, the Net Deficit was -$45B. It crossed $50B in April 2020, $60B in July 2020, $70B in Mar 2021, and $80B in Sept 2021.
There seems to be no end in sight for the ballooning trade deficits being printed each month.
Historical Perspective
Zooming out and focusing on the Net numbers shows the longer-term trend and demonstrates why Trade Deficit records will continue unabated. This plot also shows how much larger the Goods deficit is compared to the Services surplus. The Services surplus has been declining since Jan 2018.
The recent uptick in the Services Surplus can be seen on the far right. Unfortunately, this uptick is not enough to counterbalance the massive Goods Deficit. It’s also possible the Services Surplus turns back down, exacerbating the problem.
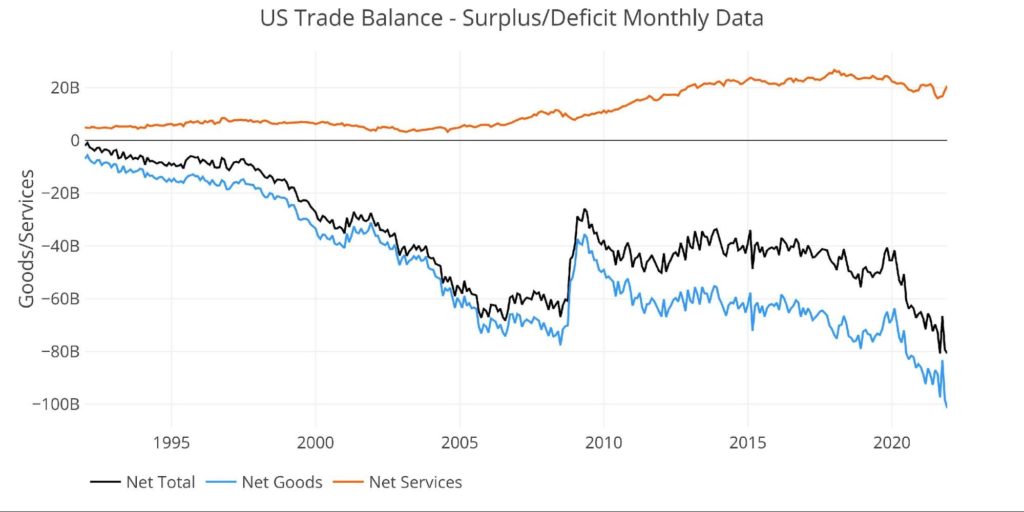
Figure: 3 Historical Net Trade Balance
The chart below zooms in on the Services Surplus to show the wild ride it has been on in recent months. It compares Net Services to Total Exported Services to show relative size. After hovering near 35% since 2013, it dropped to 25.2% in Aug 2021 but has since recovered to 29.6%.
The last two months have seen a recovery that has come from both sides of the equation. In December, Services Imports fell by $300M while Services Exports increased by $1.4B.
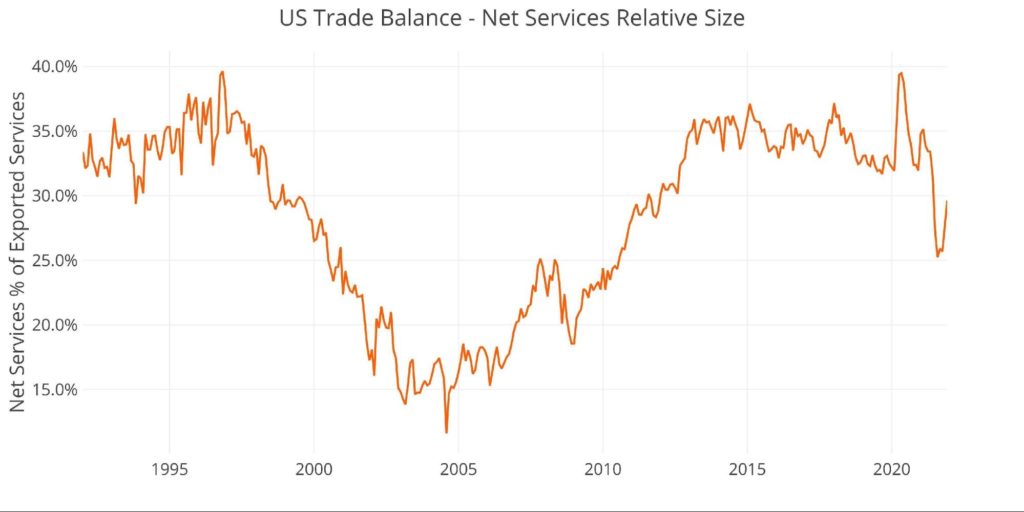
Figure: 4 Historical Services Surplus
To put it all together and remove some of the noise, the next plot below shows the Trailing Twelve Month (TTM) values for each month (i.e., each period represents the summation of the previous 12-months).
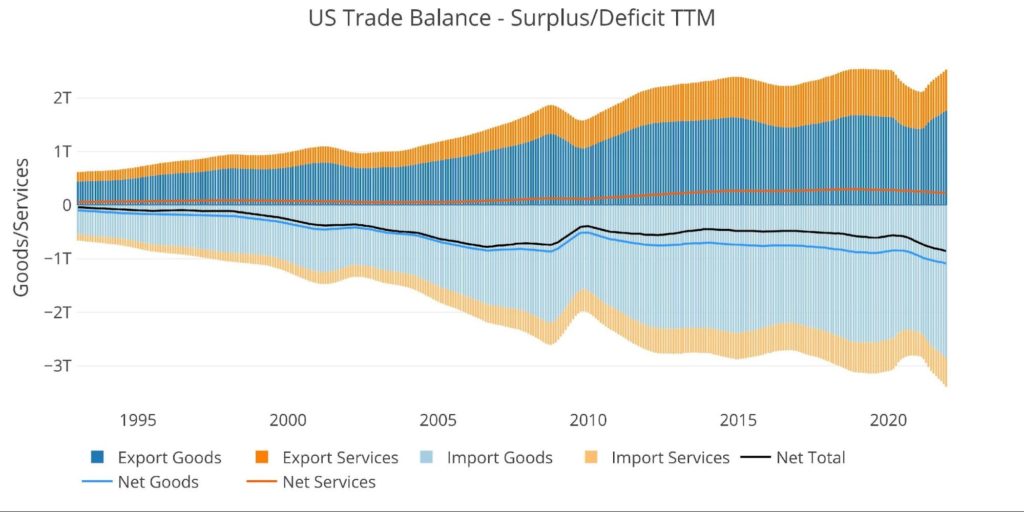
Figure: 5 Trailing 12 Months (TTM)
Although the Net Trade Deficits are hitting all-time records in terms of dollars, it can be put in perspective by comparing the value to US GDP. As the chart below shows, the current records are still below the 2006 highs before the Great Financial Crisis.
That being said, the current 3.58% is the highest since June of 2009.
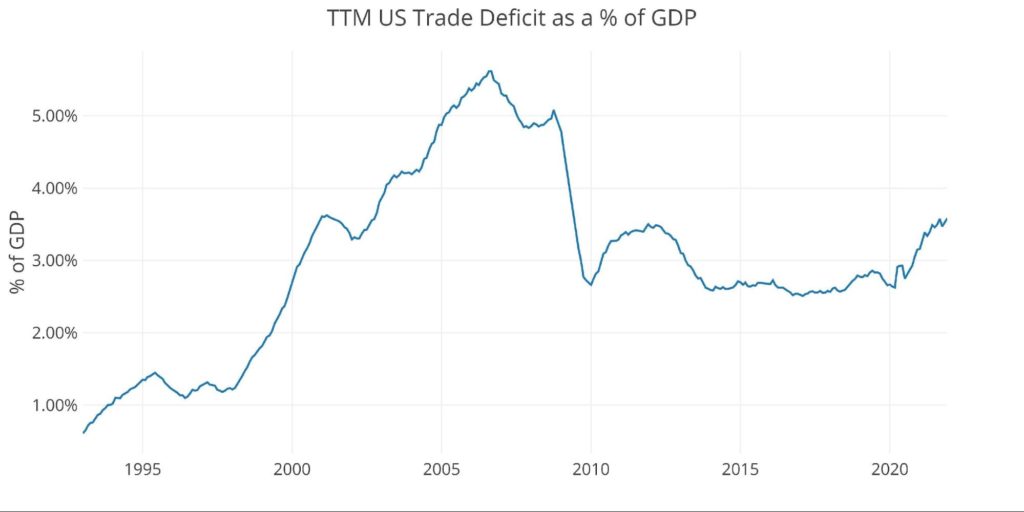
Figure: 6 TTM vs GDP
The chart below shows the YTD values. The -$859B 2021 TTM Trade Deficit shattered the old annual record of $763B set all the way back in 2006. 2021 will probably not need to wait 15 years for a new record. Based on the trajectory of the data, it will most likely fall in 2022.
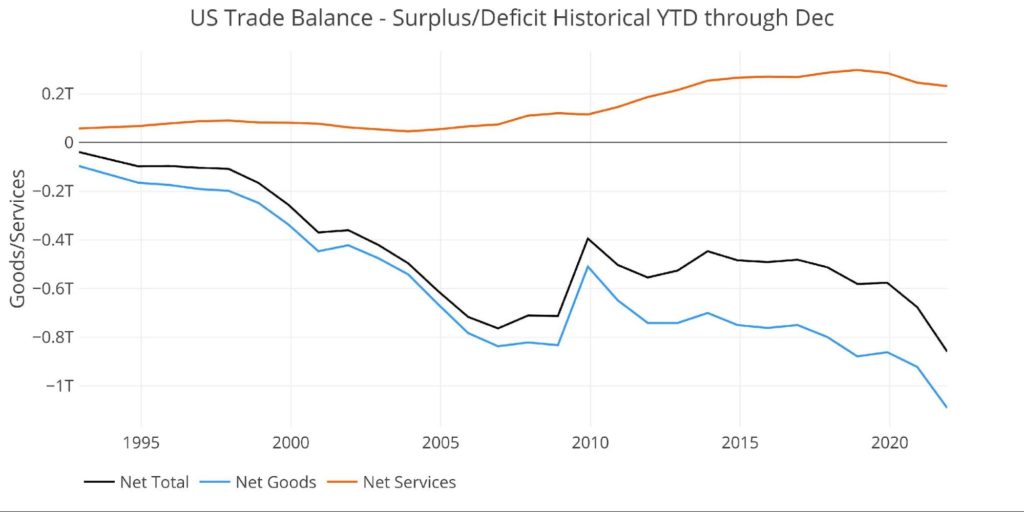
Figure: 7 Year to Date
What it means for Gold and Silver
The Trade Deficit matters for gold and silver because it shows how much the US is importing in exchange for US Dollars. A trade deficit means that the difference has to be made up with dollars rather than Goods and Services. Think about trading in a used vehicle for a new one. Because the old car is not as valuable as the new car, the customer must make up the difference with cash. The US exports are not as valuable as the imports coming into the US; thus, the difference is made up by sending dollars abroad to trading partners.
Not only does this demonstrate a weak economy that consumes more than it produces, but it means the supply of dollars around the world continues to grow. With more dollars circulating internationally, it puts downward pressure on the US dollar exchange rate when compared to other currencies. As the dollar loses value in the global economy, it supports the price of commodities measured in dollars, specifically hard currency like gold and silver.
Data Source: https://fred.stlouisfed.org/series/BOPGSTB
Data Updated: Monthly on one month lag
Last Updated: Feb 08, 2022, for Dec 2021
US Debt interactive charts and graphs can always be found on the Exploring Finance dashboard: https://exploringfinance.shinyapps.io/USDebt/

 The Comex report last month showed a lot of strength in gold which directly preceded a massive up move for the price of gold. The data is looking similar in silver this month!
 Money Supply is a very important indicator. It helps show how tight or loose current monetary conditions are regardless of what the Fed is doing with interest rates. Even if the Fed is tight, if Money Supply is increasing, it has an inflationary effect.
 The analysis below covers the Employment picture released on the first Friday of every month. While most of the attention goes to the headline number, it can be helpful to look at the details, revisions, and other reports to get a better gauge of what is really going on.
 In February, the data showed that Yellen was making a big bet that long-term rates would not stay elevated for long. This was demonstrated by the volume of short-term debt issuance. The Treasury was willing to pay higher rates to keep the maturity of the debt shorter.