

Big Jobs Miss: Leisure and Hospitality Add Zero Jobs

The Labor Department released its August jobs report on Friday. To say the numbers were disappointing would be an understatement.
According to the report, there was an increase of only 235k jobs, well below the estimated 720k. That’s a miss of nearly 500k jobs.
Despite the unemployment rate ticking down to 5.2% from 5.4% and an upward July revision by 110k, this is the weakest jobs figure since January.
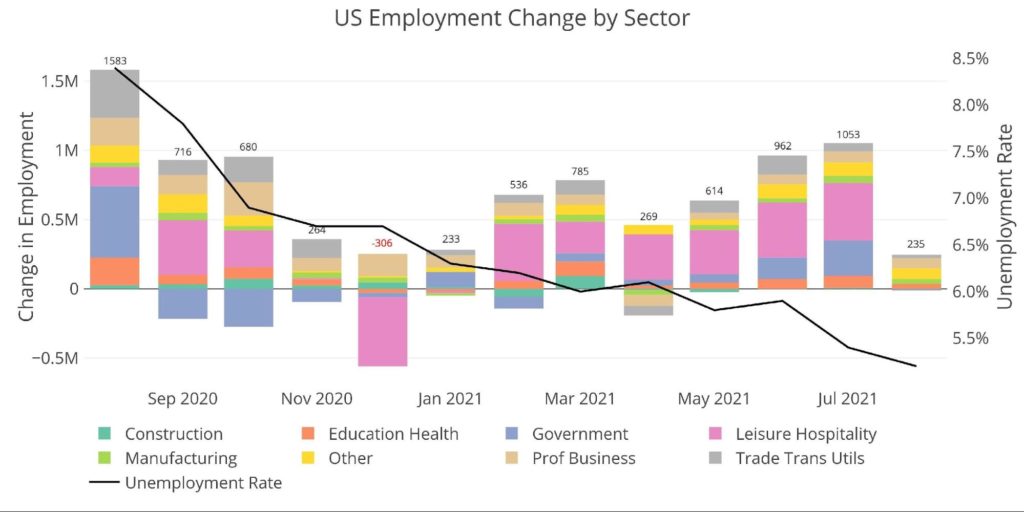
Figure: 1 Change by sector
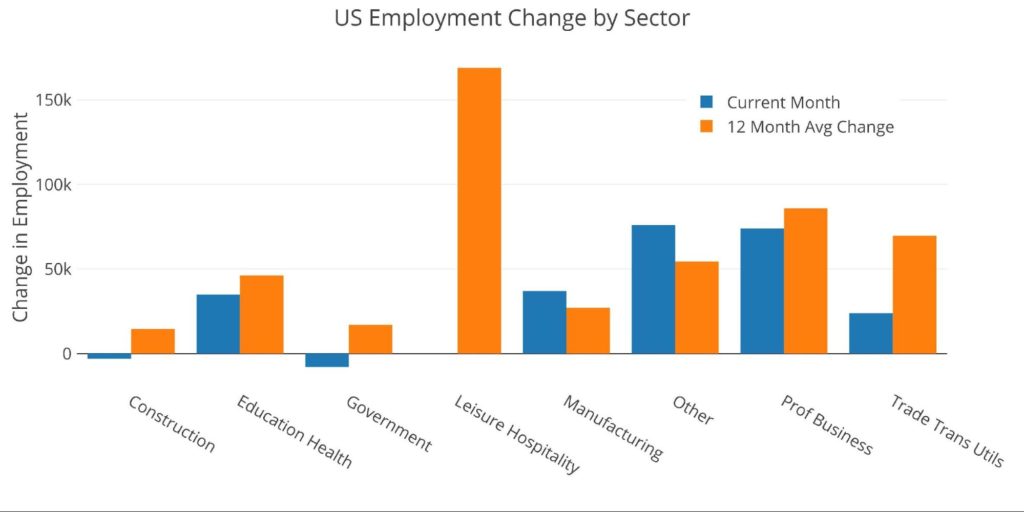
This next chart compares the current month with the trailing 12-month average. A few key takeaways:
- Leisure & Hospitality gained net-zero new jobs
- Construction and Government were negative
- Manufacturing and Other were above the recent 12-month trend
The table below gives a much more detailed breakdown of the numbers and the entire labor force. Some key takeaways:
- Leisure & Hospitality had averaged 270k over 3 months (higher than the 188k 12-month average) despite netting 0 this month
- This shows how extreme the miss was
- Trade Transportation and Utilities fell to 24k from a 3 month and 12-month average closer to 75k
- State and Local government were well below trend, possibly due to most school teachers being hired back already
- Construction has really struggled in the last 3 months, averaging 300 new jobs per month compared to a 16k monthly average over 12 months
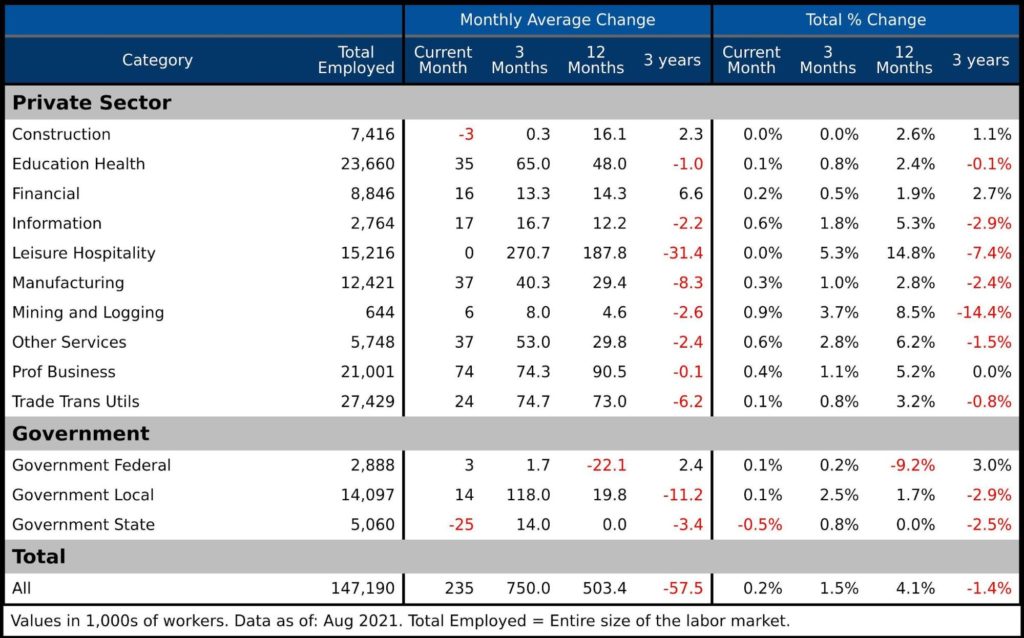
Figure: 3 Labor Market Detail
Revisions
This data is subject to revisions as new data becomes available. While the headline release gets a ton of market attention, the revisions get far less. The table below shows the impact of the revisions over different periods. Please note this is as of the prior month since the most recent month has not seen any revisions. Important items to note:
- The recent three month period has been revised up by 92K jobs per month
- Even if August is revised up by a similar 100k it would be considered a big miss
- The biggest upward revisions were seen in Leisure/Hospitality and Trade/Transportation
- Over the last year, revisions have been positive of nearly 55k a month or about 660k in aggregate
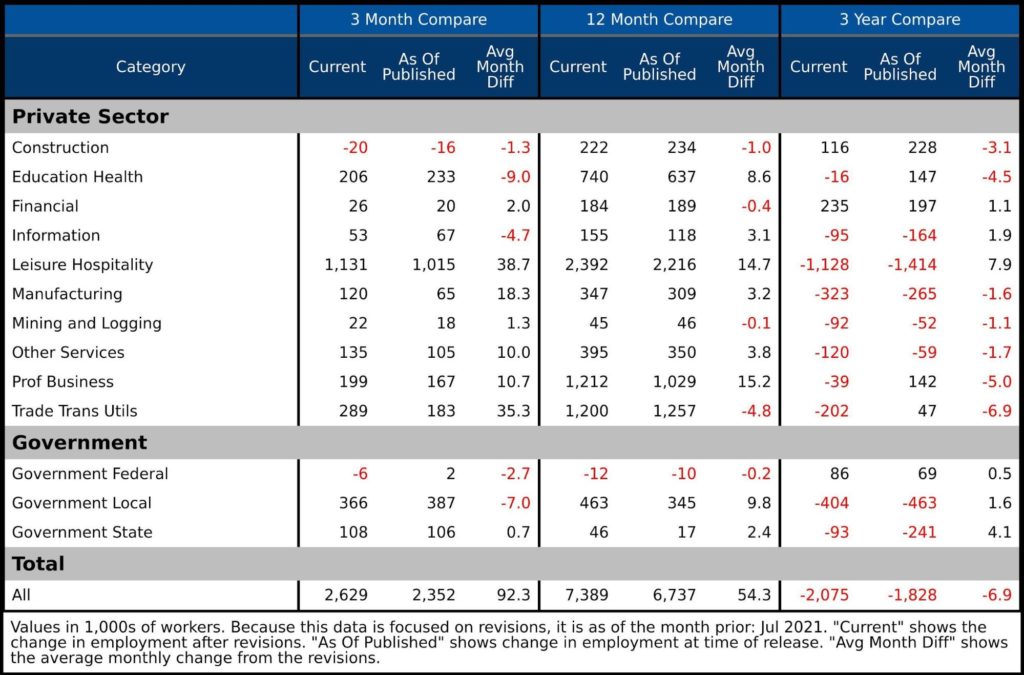
Figure: 4 Revisions
Historical Perspective
The chart below shows data going back to 1955. As the labor force has grown in total aggregate numbers, the recessions along the way have caused dips in the general trend.
The Covid recession can be seen as the greatest job market loss. The chart also shows how much work the labor market still requires to regain the employment level seen before Covid (top far right drawdown).
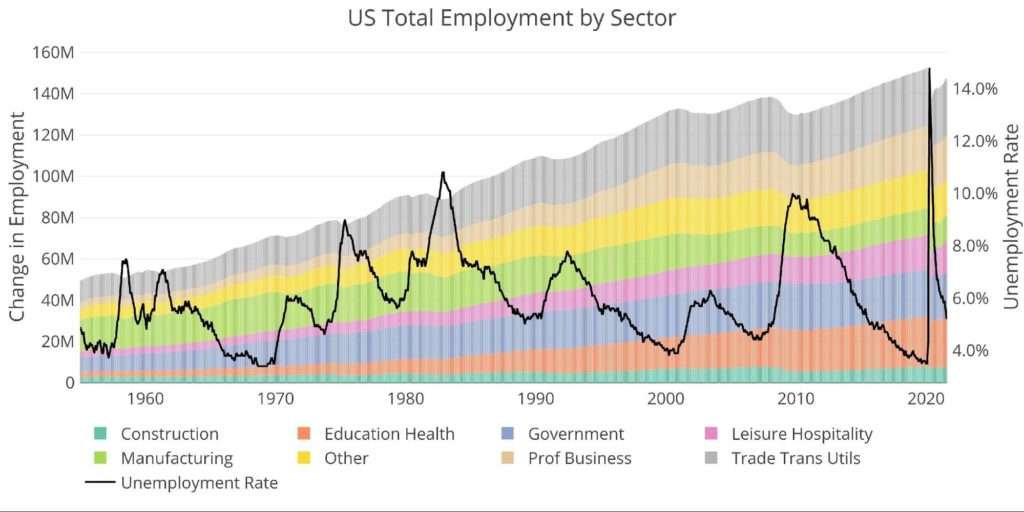
Figure: 5 Historical Labor Market
The distribution of the workforce has changed significantly over the last 65+ years. For example, in 1955, manufacturing accounted for 30% of jobs vs 8.4% today. Education/Health Care has tripled from 5% to 16%.
Although the unemployment rate has been sharply falling over the last year (chart above), the labor force participation (61.7%) is still well below 18 months ago (63.2%) and much lower than the 66% pre-financial crisis.
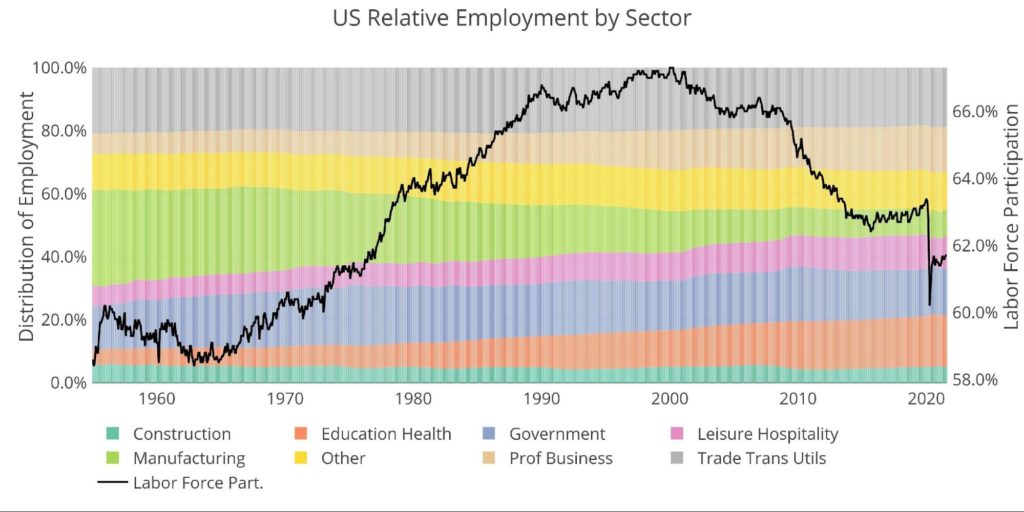
Figure: 6 Labor Market Distribution
What it means for Gold and Silver
The stock market is hyper-focused on the labor market because the Fed uses the data as one of its primary drivers for monetary policy. Although jobs data is seen as a lagging indicator, a strong labor market would more likely result in a tighter Fed. Weak job numbers allow the Fed to be more accommodating in monetary policy. This will result in more quantitative easing, growing the fed balance sheet. Additionally, fiscal support may be stronger in a weak labor market coupled with falling tax revenues. This could put more strain on the federal budget which will only increase the total debt outstanding.
While the market may anticipate tighter monetary policy and less fiscal support in a strong labor market, the Fed is painted into a corner and cannot scale back the monetary stimulus without devastating the economy. Thus, the job numbers may impact short-term movements in the price of gold and silver due to speculative flows, but the long-term positive fundamental outlook should not be impacted by strong job numbers, especially when dominated by Government job gains like the most recent report.
Data Source: https://fred.stlouisfed.org/series/PAYEMS and also series CIVPART
Data Updated: Monthly on first Friday of the month
Last Updated: Aug 2021
Interactive charts and graphs can always be found on the Exploring Finance dashboard: https://exploringfinance.shinyapps.io/USDebt/

 The analysis below covers the Employment picture released on the first Friday of every month. While most of the attention goes to the headline number, it can be helpful to look at the details, revisions, and other reports to get a better gauge of what is really going on.
 This analysis attempts to look at different metrics to understand the current momentum in the gold and silver markets. It is meant as an analysis of potential price direction in the very short term (1-2 weeks).
 The Comex report last month showed a lot of strength in gold which directly preceded a massive up move for the price of gold. The data is looking similar in silver this month!
 Money Supply is a very important indicator. It helps show how tight or loose current monetary conditions are regardless of what the Fed is doing with interest rates. Even if the Fed is tight, if Money Supply is increasing, it has an inflationary effect.