


Please note: the COTs report was published 6/3/2022 for the period ending 5/31/2022. “Managed Money” and “Hedge Funds” are used interchangeably.
Gold
Since the peak on March 8, Managed Money has massively reduced its Net Long positions by 98k contracts or 66%. Despite massive selling, the gold price has actually held up fairly well. The last time Managed Money net longs dropped this low in February, gold was struggling at the $1800 level, versus the struggle at $1850 now.

The May jobs report was widely regarded as strong. The US economy added 390,000 jobs, according to the latest data. But a deeper dive into that data reveals that the labor market might not be as strong as the mainstream spin is leading you to believe. Even with all the new jobs, hiring slowed in five out of eight sectors.

The following provides an in-depth analysis of the COMEX futures options market for gold and silver.
Gold: Recent Delivery Month
Gold started June delivery with 22,394 contracts outstanding. This is below April and December, but above August, October, and February. It is about on par with last June.

Despite rising through the month, the Fed balance ended up shrinking slightly by $25 billion in May, even as it slightly increased its Treasury holdings.
This was the first monthly decline in the balance sheet since $220B of “Other” rolled off in July 2020. In that case, “Other” were repurchase agreements with foreign entities to provide liquidity and alleviate stress in the global markets.

According to the seasonally adjusted data, M2 contracted by $83B in April. The Money Supply analysis last month highlighted the slowing money supply growth rate, but this is the first contraction seen since January 2010.
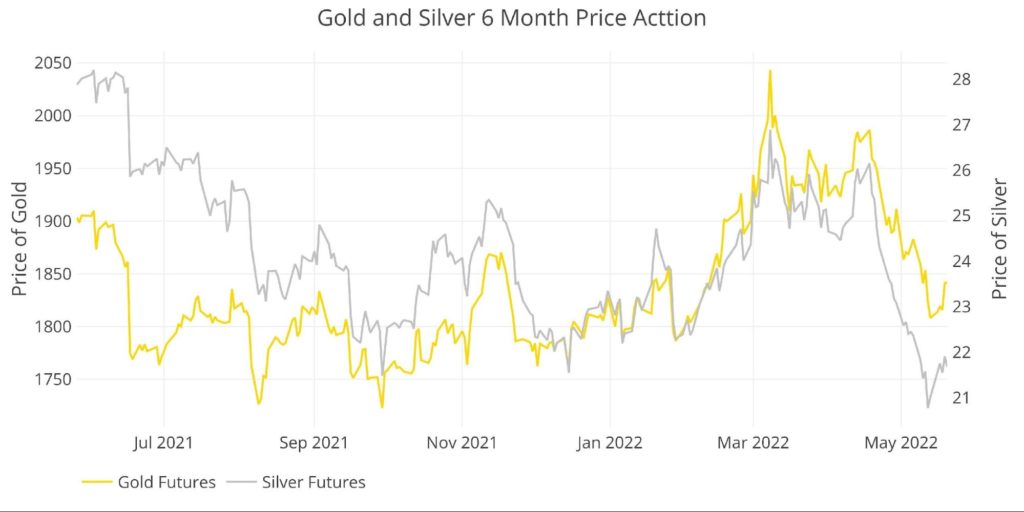
The price analysis last month identified the near-term risk that gold could fall below $1880 and even $1850 despite a medium-term bullish outlook. The $1800 level was identified as a key marker for keeping the bull move intact. So far, that has held and produced a solid bounce back towards $1850 which becomes the next hurdle.

This analysis focuses on gold and silver physical delivery on the Comex. See the article What is the Comex for more detail.

This analysis focuses on gold and silver within the Comex/CME futures exchange. See the article What is the Comex? for more detail. The charts and tables below specifically analyze the physical stock/inventory data at the Comex to show the physical movement of metal into and out of Comex vaults.
Tax revenues have been on the rise for about 18 months. As speculated previously, if this windfall was temporary, it would have shown up with a deficit in April due to a higher than normal tax returns surge. April is historically a positive month for the Treasury, but a surge in tax returns leading to a deficit would have suggested the past year was potentially a fluke.

The latest seasonally adjusted inflation rate for April came in higher than expectations at 0.34% MoM and 8.28% YoY. The main driver for the MoM slowdown was a fall in Energy prices.
