

By Dennis Miller from Casey Research
If the “World Snake-Oil Salesperson Society” had a hall of fame, good old Uncle Sam would be a charter member. When it comes to smooth-talking folks into buying debt instruments, he’s the slickest around.
And Treasury Inflation-Protected Securities (TIPS) are one of his slickest gimmicks.
Here’s how the federal government describes TIPS:
Treasury Inflation-Protected Securities (TIPS) are marketable securities whose principal is adjusted by changes in the Consumer Price Index. With inflation (a rise in the index), the principal increases. With deflation (a drop in the index), the principal decreases.
The relationship between TIPS and the Consumer Price Index affects both the sum you are paid when your TIPS matures and the amount of interest that a TIPS pays you every six months. TIPS pay interest at a fixed rate. Because the rate is applied to the adjusted principal, however, interest payments can vary in amount from one period to the next. If inflation occurs, the interest payment increases. In the event of deflation, the interest payment decreases.
When a TIPS matures, you receive the adjusted principal or the original principal, whichever is greater. This provision protects you against deflation.
Sounds like a surefire winner, right? If inflation goes up you’re protected, and if deflation occurs, you’ll still earn interest on the original principal.
When TIPS were introduced in 1997, my broker suggested them to me. My response was, “Okay, I’m the lender, right? And the amount of the loan, the interest rate, and the time frame are fixed. The only variable is the size of the final principal payment based on the inflation rate determined by the Consumer Price Index (CPI), and the borrower gets to keep score? I don’t think so!”
Let’s look at the details. Both the interest and principal growth are taxed. If the government calculates the inflation and pays out a net 4%, the investor must pay federal income tax on the income. That sure seems like a guaranteed way not to keep up with inflation!
And the picture gets even worse in today’s economic climate. The government’s version of the inflation rate, which it uses to adjust the interest and principal payments, is currently 3% – but that’s really a lowball estimate. In the last few decades, the government has significantly changed how it calculates inflation. Using the government’s 1990 method, Shadowstats reports that the true inflation rate is really 6.2%, which is a much more realistic figure. If that’s the case, the loss of buying power to inflation is even greater. Not only does the investor lose to inflation by being taxed on the income, he also loses because the true inflation rate is higher than the government’s rate. This results in a final principal payment lower than the true inflation rate. I would call that a double-barreled loser!
The government has changed its method of calculating the many times, and I urge readers to visit John Williams’ ShadowStats website to see how. He clearly explains why true inflation is much higher than the figures the government calculates and reports.
I recently spoke with John, and he believes many consumers are under the illusion that the CPI is based on a constant basket of goods, and that their respective price changes are measured over time. In his research, he outlines substitutions the CPI has made and the political significance of those changes.
In 1949, Benjamin Graham wrote an investment bible called The Intelligent Investor, and many pundits and advisors reference his work to justify their recommendations. Graham passed away before TIPS were introduced, but Jason Zweig has added some significant comments to the most recent publication of Graham’s book, including a discussion on TIPS.
Because of the taxable nature of TIPS, Zweig suggests owning them inside an IRA or some other type of tax-sheltered account. He offers the following notes on TIPS:
In one easy package, you insure yourself against financial loss and the loss of purchasing power.
Either directly or through a fund, TIPS are the ideal substitute for the proportion of your retirement funds you would otherwise keep in cash.
For most investors, allocating at least 10% of your retirement assets to TIPS is an intelligent way to keep a portion of your money absolutely safe – and entirely beyond the reach of the long, invisible claws of inflation.
I would have agreed with the author when he wrote the book, but times have changed.
Most successful investors have a couple of things in common. First, they’re not blinded by smokescreens and can see things as they really are. Second, they understand cause and effect. I suspect Graham, who had both of these qualities, would see TIPS for what they really are. When one applies these two principles to TIPS, a few conclusions become clear.
• TIPS won’t protect against inflation if they’re not held in a tax-sheltered account.
• If the government adjusts the principal of TIPS based on the inflation rate, the best an investor can hope for is to stay even with inflation.
• If John Williams’ inflation numbers are accurate, a TIPS investor risks losing a good portion of his life savings to the ravages of inflation.
Unfortunately, financial planners tend to perpetuate the myth that TIPS adequately protect against inflation. Recently, when I asked a Certified Financial Planner at a major brokerage firm how he protected his clients from the potential ravages of high inflation, he said he recommended TIPS. When I asked if they were doing anything else, he answered, “Not really.” Several of my friends with managed accounts have also said their money managers “protect” them with TIPS.
Many financial planners simply take all of a client’s financial information and plug it into the company computer, which then produces a report outlining a suggested financial strategy. If the person writing the computer program plugged TIPS into the formula, that’s among the items a final report may suggest. If your planner insists that any of your money should be invested in TIPS, I would certainly ask for a solid explanation.
In my opinion, TIPS do the opposite of what they’re supposed to do. With inflation on the rise and some creative accounting on the part of the scorekeeper, I think TIPS are a terrible investment. I urge every reader to do his own due diligence. Questioning financial planners and money managers may lead to some stressful conversations, but the risk of losing a large portion of your nest egg to inflation warrants taking the time to educate yourself by demanding answers.
Many friends have asked me what they should invest in to protect themselves against inflation. Unfortunately, they’re looking for an easy answer that doesn’t exist. Only a combination of investments can accomplish the goal.
Many readers may remember an entertainer named Alex Karras who also played professional football for the Detroit Lions. At the time, the Lions had a terrific defensive team and a horrible offense. When a reporter asked Karras for his prediction on the upcoming season, he replied, “I predict we will play to a lot of scoreless ties!”
If you’re heavily invested in TIPS, a scoreless tie is the best you can hope for. We have much higher aspirations.
How I Realized the Government Lies about Broccoli
As a kid, I was led to believe the federal government was close to God. If a report came out from the government or even Walter Cronkite, no one considered questioning its authenticity. It was fact.
But somewhere in my 20s, I actually started to think for myself a bit more and question certain things, including the government and its messages.
It all started with a headline-making government report. Apparently if I didn’t eat broccoli – I mean at least two big helpings each week – I was certain to die of cancer by the end of the decade. Now, I hate broccoli. I hate the taste of it, the smell of it, and even the idea of having to eat it to survive. I began to suspect something was fishy.
Shortly thereafter, there was a big editorial about Washington lobbyists corrupting America. I looked down the list and sure enough, there was a big broccoli lobby. Bingo! The broccoli lobby had corrupted the research process in the US. It bought and paid for the study that published the data indicating I had to eat two big helpings a week to avoid an early deathbed. Wasn’t it that same broccoli lobby that paid someone to dump truckloads of broccoli on the White House lawn when Bush the First was president?
That was a traumatic day for me, realizing that the federal government could be paid to educate the public about something that wasn’t true… particularly regarding broccoli.
I’ve finally concluded that any government that will lie to its constituents about big things like broccoli will think nothing of lying to them about little things like unemployment numbers, the inflation rate, nuclear weapons in Iraq, or the Vietnam War. Once it gets comfortable lying about the big stuff, the little ones come easy.

It looks like gold is ready to complete the year with a 6% gain, continuing it’s longest streak since 1920, according to Bloomberg. Jeff Clark of Casey Research has reviewed the opinions of prominent gold bugs and the many reasons why 2013 looks like another shiny year for the yellow metal:
While the older generation of politicians and central bankers seem intent on spending the United States into insolvency, perhaps the younger generations can learn from the past. Travis N. Taylor published an op/ed in the Washington Times this week calling on 18-29 year-olds to support a return to the gold standard:
“Although the federal government’s gross inability to balance a checkbook is a cause of great concern, it remains true that “all politics is local.” Few people can pay attention to Washington’s “fiscal cliff” when they are struggling to provide for the well-being of their family.
Millennials must encourage the return to a precious-metals-backed monetary system. Regardless of difficult-to-understand technical terms, there is plenty of empirical evidence that a departure from the gold standard has shattered our monetary system. The United States officially ended the gold-backed dollar standard in 1971. This offers a bright line of distinction for examining the issue. The 40 years since that time have borne witness to prices on everyday goods that are radically higher than during the previous four decades.”
Gold’s poor performance in the past week has triggered a flood of commentaries declaring that gold peaked back in 2011 and that prices may plummet next year. Don’t be fooled – there is plenty of evidence that gold still has a bright future. Tim Iacono published an interesting article on Seeking Alpha yesterday debunking the naysayers:
“Since the gold price failed to advance after the Federal Reserve’s latest stimulus measure last week, that is, the one where the central bank raised its open-ended money printing effort to a cool $1 trillion per year, an increasing number of calls have been heard with the same refrain – the secular gold bull market is over.
Earlier in the month, it was investment bank Goldman Sachs who said that prices may rise back up above $1,800 an ounce next year but that last year’s high at just over $1,900 an ounce or a similar high next year will go down in the history books as the end of the long-running bull market.”

As expected, today the Fed announced it will expand its balance sheet by continuing to purchase long-term Treasuries after Operation Twist expires. The Fed remains committed to buying government debt and keeping interest rates near zero until unemployment drops to 6.5%, which it admits probably won’t happen until 2015. Surprise, surprise, gold prices rose on the news, and the dollar fell.
Metals Analyst Kira Brecht published an incisive commentary on Kitco yesterday on the long-term gold trend, examining the relationship between gold and the quantitative easing of central banks:
“But, what will it take to kill the long-term bull market in gold? Listen up folks and listen good. There is nothing on the near or medium term horizon that could kill the long-term bull market in gold.
Why? The answer is quite simple and lies in the hands of global central banks, with their pedals still pressed to the floor with unusual and historic monetary policy accommodation and easing.”
Get Peter Schiff’s latest gold market analysis – click here – for a free subscription to his exclusive weekly email updates.
Interested in learning more about physical gold and silver?
Call 1-888-GOLD-160 and speak with a Precious Metals Specialist today!

By Jeff Clark from Casey Research
Have you ever wondered what the typical Chinese gold investor thinks about our Western ideas of gold? We read month-after-month about demand hitting record-after-record in their country – so how do they view our buying habits?
Since 2007, China’s demand for gold has risen 27% per year. Its share of global demand doubled in the same time frame, from 10% to 21%. And this occurred while prices were rising.
Americans are buying precious metals, no doubt. Gold and silver ETF holdings just hit record levels. The US Mint believes that 2012 sales volumes will surpass those of 2011.
But let’s put the differences into perspective. This chart shows how much gold various countries are buying relative to their respective GDPs:

(Click to enlarge)
It’s widely believed that the majority of the gold flowing into Hong Kong ends up in China, so its total is probably close to double what the chart reflects. Even if none of it went to China, coin and jewelry demand is 35 times greater than the US, based on GDP.
The contrast between how our two nations can buy bullion is striking…
- In China, you can buy gold and silver at the bank. My teller looked at me oddly when I asked.
- Bullion is available for purchase at Chinese post offices. I wonder how my local postman would respond if I asked for a tube of silver Eagles.
- Mints are readily accessible to retail customers. Here, I can only order proof and commemorative products from the US Mint and am forced to go to an independent dealer.
- A new product design is manufactured every year. This being the Year of the Dragon, many bullion products are emblazoned with dragons. You can still buy last year’s rabbit, and next year it will be a snake. The US has two designs, the Eagle and Buffalo; the latter was introduced in 2006 and is available only in gold (if you see a silver Buffalo, it is a “round” manufactured by a private mint, not the US Mint).
Some will point to cultural affinity to account for the differences. There’s some truth to that, though this is a much greater factor in India. Even there, gold jewelry is not viewed as a decoration or an adornment; it’s a store of value. It is financial insurance in a pretty bow. In India, gold can be used as collateral, regardless of its form. It’s not just an investment that they’re trying to make money from; it’s more important than that.
But certainly the differences can’t all be attributed to culture…
You’ve likely heard how government leaders in Beijing have been encouraging citizens to buy gold and silver. This would be akin to seeing your local Congressman or President Obama appearing on TV and imploring you to buy some gold and silver. (Utah made gold legal tender, but it was mostly a symbolic move.)
Chinese radio and TV spots, along with newspaper ads, talk about “safeguarding your wealth” and putting “at least 5% of your savings” in precious metals. I haven’t seen this here except from bullion dealers themselves. Can you imagine Ben Bernanke appearing in a commercial during American Idol, encouraging you to buy gold Eagles?
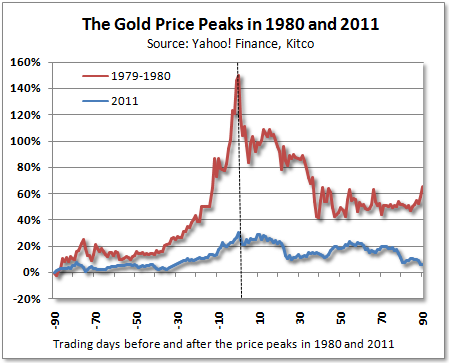
No, what I hear from politicians about precious metals is nothing but the sound of crickets chirping – save Ron Paul. And the mainstream continues to claim gold is in a bubble. We’ve pointed it out before, but in case any of them are reading, there are two criteria for a bubble: first, a massive price increase, such as the gold price doubling in less than 7 weeks like it did in 1979-’80… which, of course, hasn’t occurred in this bull market.
The second criterion is widespread participation on the part of the public. I don’t hear celebrities and TV anchors bubbling on about the latest gold stocks. Most people I know outside Casey Research aren’t talking about the great price they got on a silver Maple Leaf. Most investors I talk to say their friends, family, or co-workers aren’t scrambling to snatch up gold Eagles. And the #1 reason we’re not in a bubble is because Eva Longoria still hasn’t asked me out on date – something she’d only do because I’m a gold analyst.
And with apologies to those of you who do know history, I think the Chinese have studied history a little better than many of us. The lessons are right in front of us, though I don’t hear this kind of data very much on CNBC…
- Morgan Stanley reports there is “no historical precedent” for an economy that exceeds a 250% debt-to-GDP ratio without experiencing some sort of financial crisis or high inflation. Total debt (public and private) in the US is 300%+ of GDP.
- Detailed studies of government debt levels over the past 100 years show that debts have never been repaid (in original currency units) when they exceed 80% of GDP. US government debt is approaching 100% of GDP this year.
- Peter Bernholz, a leading expert on hyperinflation, states emphatically that “hyperinflation is caused by government budget deficits.” This year’s US budget deficit will be about $1.3 trillion. It’s expected to total $6 trillion during Obama’s first four years in office.
What do we hear instead? That the country will drop into recession if current amounts of spending and outlay of benefits are reduced. I think it is quite the opposite; it will be worse if our leaders continue down this path of debt, deficit spending, and printing money.
What I’d love to see on CNBC is a spot with Doug Casey saying this: “Anyone who thinks they have any measure of financial security without owning any gold – especially in the post-2008 world – is either ignorant, naïve, foolish, or all three.” I bet that’d get the airwaves buzzing.
It must seem strange to many Chinese that we continue to believe in our dollars, Treasuries, and bonds more than gold and silver. And it’s not just China that would view our investing habits as peculiar. Indeed, as the above tables implies, our views on precious metals are in the minority.
My fear is that regardless of what form the fallout takes, many of my friends will be caught off-guard. Probably many of yours, too. As the value of dollars continues to decay and inflation creeps closer and closer and then higher and higher, many investors will feel blindsided. Many Chinese citizens will not.
Given China’s aggressive buying habits, my suspicion is that many of them will probably wonder why we didn’t see what was happening all around us, why we didn’t learn from history, and why we didn’t better prepare.
Part of the reason why American dollars are losing value can be traced to Chinese actions as well: Realizing that the US government was not going to rein in its profligate spending, the Chinese have stopped investing in the US economy and are now dumping dollars. This, of course, simply adds to the US government’s problems… but it provides ways for you to turn a tidy profit.
The media has stirred up a lot of fear about the possibility of actually going over the fiscal cliff in the new year. However, Peter Schiff maintains that the cliff is an essential step in repairing the economy. He also continues to stress how much safer gold is than dollar-denominated assets, especially Treasuries:

By Jeff Clark from Casey Research
While I don’t like making price predictions, and certainly ones accompanied by a specific date, it’s hard to ignore the correlation between the US monetary base and the gold price.
That correlation says we’ll see $2,300 gold by January 2014.
There are plenty of long-term charts that show a connection between gold and various other forms of money (and credit). Most show that one outperforms until the other catches up. But let’s zero in on our current circumstances, namely the expansion of the US monetary base since the financial crisis hit in 2008.
Here’s the performance of gold compared to the expansion of the monetary base since January 2008:

(Click to enlarge)
You can see the trends are very similar. In fact, the correlation coefficient is an incredible +0.94.
Since the Fed has declared “QEternity,” it’s logical to conclude that this expansion of the monetary base will continue. If it grows at the same pace through January 2014, there is a high likelihood the gold price will reach $2,300 at that point. That’s roughly a 30% rise within 15 months.
And by year-end 2014, gold could easily be averaging $2,500 an ounce. That’s 41% above current prices.
Some may argue that there’s no law saying this correlation must continue. That’s true. And maybe the Fed doesn’t print till 2014. That’s possible.
But it’s not just the US central bank that’s printing money…
- European Central Bank (ECB) President Mario Draghi has declared that it will buy unlimited quantities of European sovereign debt.
- Japan’s central bank is expanding its current purchase program by around 10 trillion yen ($126 billion) to 80 trillion yen.
- The Chinese, British, and Swiss are all adding to their balance sheets.
The largest economies of the world are all grossly devaluing their currencies. This will not be consequence-free. Gold and silver will be direct beneficiaries.
There are other consequences, both good and bad, of gold hitting $2,000 and not stopping there. We think investors should be prepared for the following:
- Tight supply. As the price climbs and attracts more investors, getting your hands on bullion may become increasingly difficult. Delivery delays may become commonplace. Those who haven’t purchased a sufficient amount will have to wait in line, either figuratively or literally.
- Rising premiums. A natural consequence of tight supply is higher commissions. They won’t stay at current levels indefinitely. Premiums doubled and more in early 2009, and mark-ups for silver Eagles and Maple Leafs neared a whopping 100%.
- Tipping point for a mania. There will be an inflection point where the masses enter this market. The average investor won’t want to be left behind. Will that happen when gold hits $2,000? $2,500?
The message from these likely outcomes is to continue accumulating gold – or to start without delay. Waiting will have consequences of its own.
People say that there’s nothing certain in life except death and taxes. In my view, $2,300 gold is a close second.

By Jeff Clark from Casey Research
In early July, Japan set a premium price for solar energy that was three times the rate of conventional power. This meant utility companies would be paid three times more for electricity sourced from solar. It’s widely expected that the premium will ignite the use of solar power – and solar uses a lot of silver.
Silver Demand from Solar Panels
As you may know, silver is used in photovoltaic (PV) technology to generate solar power. A typical solar panel uses a fair amount of the metal – roughly two-thirds of an ounce (20 grams). To put that in perspective, a cell phone contains around 200 to 300 milligrams (a milligram weighs about as much as a grain of sand). A laptop contains 750 milligrams to 1.25 grams.
Photovoltaic technology is relatively young, but each year its use is growing rapidly. Just since 2000, the amount of silver consumed by solar-panel makers has risen an average of 50% per year. Demand grew from one million ounces in 2002 to 60 million ounces in 2011. Last year, demand from the PV industry represented almost 11% of total industrial demand for the metal (excluding jewelry). According to statistics from CPM Group, demand grew by 11.2 million ounces, the strongest volume growth of all major sources. And this was before the Japanese announcement was made.

(Click to enlarge)
The largest end-user of solar panels is Germany, though that’s changing. Last year, Germany accounted for 27.3% of global installations, but due to subsidy cuts, solar-panel installation capacity dropped from 7.7 gigawatts to 7.5. But in the big picture, that decline was offset by increases in China, France, Italy, the UK, Japan, and the US.
In their 2012 Yearbook, CPM projected a slight decline in silver demand from solar panels due to a reduction of new installation in Europe and oversupply from excess production in China. But with the initiative from Japan, that estimate is almost certainly low.
Japan Gives New Life to the PV Industry
After the Fukushima disaster, Japanese authorities wanted to cut the nation’s dependence on nuclear energy. Approximately 30% of Japan’s power was generated by nuclear before the catastrophe; now the focus has shifted to other green energy alternatives, including solar.
The new tariffs might work. The suggested rate of ¥42([Article].53) per kilowatt hour (expected to be maintained for 20 years) is more than twice the rate in Germany (€0.17 – or [Article].246). Bloomberg estimates that this generous increase will create $9.6 billion of investments in Japan alone.
Here’s what that amount of money would do to the sector: there were approximately 1.3 gigawatts of solar capacity installed in 2011, but experts anticipate that number to nearly double to 2.3-2.5GW for 2012, and hit 3.0GW in 2013. According to SolarBuzz, Japan could see 28GW of solar capacity installed by 2020 and 50GW by 2030.
That’s a lot of solar panels, and – even assuming improved efficiency – it’ll take a lot of silver.
Price Factors
During recent years, solar panels have become significantly less expensive and more end-user friendly. However, the fact that each panel contains a lot of silver can make it susceptible to large price fluctuations. If the silver price gets too high, manufacturers might seek alternatives, of course, but they can’t easily eliminate use of the metal. And if the product gets too expensive, demand could fall. Companies are already looking for ways to reduce the amount of silver used in PV panels or to replace it with another element.
At the moment, there are two main solar panel technologies on the market. The traditional one is “thick film,” where silver is the main component. The other one is a less-expensive “thin-film” method which replaces silver with another material, cadmium telluride. The development of thin-film solar panels has picked up due to its lower price, but the technology is less effective. Thick film is more efficient in gathering energy from the sun, and this type of panel still prevails on the market. CPM reports that it accounted for roughly 91% of total installations last year, and analysts expect thick-film panels to maintain their dominance for at least the next several years. Further, both panel types use silver outside of the cell for reflectivity and other functions, so the odds of silver being eliminated from solar panels entirely are very low at this time.
For investors, this means that at least in the near term, the solar industry will continue to use silver-intensive technology, thus supporting growing industrial demand for the metal.
But that’s not all, folks…
New Era for Silver Usage
For a long time, silver industrial demand was dependent almost entirely on one industry: photography. Silver-based camera film dramatically changed the structure of silver demand at the beginning of the 20th century. By that time, silver had primarily been used in silverware, jewelry, and as money. At its peak, photographic demand accounted for about 50% of the market.
But this is the 21st century, and in spite of substantial declines in film use, the modern world has developed many other important uses from silver’s unique properties. Probably the most important shift is that industrial demand for silver no longer comes from a single field, but from numerous applications – almost too many to count – virtually none of which show any signs of slowing. This fact makes the forecast for silver demand more positive and stable; when one industry drops, others may offset the decline.
Here’s a smattering of uses, many of which are still in their infancy:
- Solid-state lighting (SSL), which uses semiconductors to produce light with either light-emitting diodes (LED) or organic light-emitting diodes (OLED), rather than the more traditional electrical filaments. SSL is used in traffic lights and some car headlamps.
- Radio frequency identification (RFID) uses printed silver ink made from silver nitrate. RFID chips have become so ubiquitous, it’s hard to find any new product that doesn’t have at least one – even if that’s only in the security tag affixed to the package.
- Supercapacitors and superconductors, autocatalysts, and new types of more effective batteries.
- Medical applications like aseptic coverings for surgery, traumatic wounds, antibacterial bandages and fabrics, dental amalgam, and silver salts that help prevent infections in newborns. It’s also used as a cure for dermatological problems and certain types of cancer.
- Water purification systems, washing machines, air conditioners, and refrigeration. NASA used silver to sterilize recycled water aboard the space shuttle.
- Food packaging and preservation. Manufacturers of commercial ice machines are using silver-embedded hoses, clamps, pipe fittings, and other places where gunk can build up and harbor bacteria. Meat processors use silver-embedded tables, grinders, tools, and hooks. Silver is used to keep fruit, vegetables, and cut flowers fresh while in transit.
- Public hygiene, such as antimicrobial protection of telephone receivers, door handles, bed rails, toilet seats, counter tops, children’s toys, socks, underwear, bed linen, towels, etc.
- Other wide-ranging consumer products used every day: makeup, antibacterial soaps and kitchenware, hand and air sanitizers, and facial creams and masks.
Though the total contribution from these new silver uses is relatively modest, the Silver Institute rather dryly forecasts that “there is a potential for a number of these segments to boost their silver consumption.” As you can see in the chart below, its forecast for silver demand for new industrial uses projects that the biggest increases will be in batteries, SSL, and RFID.

(Click to enlarge)
The primary uses for silver are growing, too. For example, the automobile industry is increasing consumption, due to both increases in the number of vehicles manufactured and the expanded use of electrical contacts. As the number of improvements in vehicles increase, so does the amount of silver used. For example, silver is used to control seat and mirror adjustments, windshield wipers, and manage navigation systems.
Based on their research, the Silver Institute forecasts that industrial usage will rise to 665.9 million troy ounces by 2015 and account for more than 60% of total fabrication demand.


(Click to enlarge)
What It Means for Investors
The bottom line on the above is that the growing number of industrial applications for silver represents a long-term shift in this market. Increasingly diverse usage is not only here to stay but will continue to grow, supporting the price and having an impact on the balance of supply and demand.
For investors, the thing to keep in mind is that while long-term prospects for silver prices are extremely bullish, to the degree prices are driven by this increased industrial demand, they are vulnerable to economic correction/contraction in the short term.
Invest accordingly.
