

The Cause and Evidence of Inflation
Michael Pento’s Market Commentary
In a heated debate on the February 1st episode of CNBC’s “The Kudlow Report”, financial commentator Donald Luskin offered his “textbook” definition of inflation as “an overall rise in the general price level.” I countered with the “dictionary” definition. My 1988 edition of Webster’s Dictionary defines inflation as follows: “An increase in the volume of money and credit relative to available goods, resulting in a substantial and continuing rise in the general price level.” [Emphasis added.] These differences are not academic and go a long way toward explaining why economists argue so vociferously.
In an inflationary environment, general prices tend to rise, although particular market segments tend to do so at uneven rates. This is hardly controversial. The more disputed question is why prices rise in the first place. As Luskin is well aware, the US Dollar is backed by nothing but confidence and perception. Its value depends upon our collective belief in its current and future purchasing power, and the hope that its supply will be restricted. When its supply is increased, users of the currency lose faith in its buying power and prices rise.
As a corollary, if dollar-holders believe that the US will have no choice but to monetize trillions of dollars of Treasury debt in the near future, the currency will falter. In this manner, currencies that are backed by nothing but confidence tend to behave like stock prices. The share value of a corporation represents the strength of the company. Likewise, the value of a currency represents the strength of a sovereign state.
Looked at through this prism, the fate of the US dollar in the future may not be all that different from the fate of Enron shares in 2001. In the 1990s, Enron was one of the most respected corporations in America, and the share price soared. But once the accounting scandal broke, and Enron’s profits were proven to be illusory, the purchasing power of its shares plummeted. Eventually, the shares became worthless.
The shares did not collapse simply because Enron issued more shares and diluted value. The big change came when investors lost faith in Enron. Likewise, the US dollar may lose value because of garden-variety dilution, but the real leg down will occur if holders of US government debt lose faith that they will be paid in full. Even if there is the mere perception such an outcome is likely, it will cause the dollar to tank and aggregate prices to rise.
The Fed and Treasury have set out on a deliberate strategy of creating inflation in order to monetize most of the $14.1 trillion national debt— a debt that is growing by well over a trillion dollars per year!
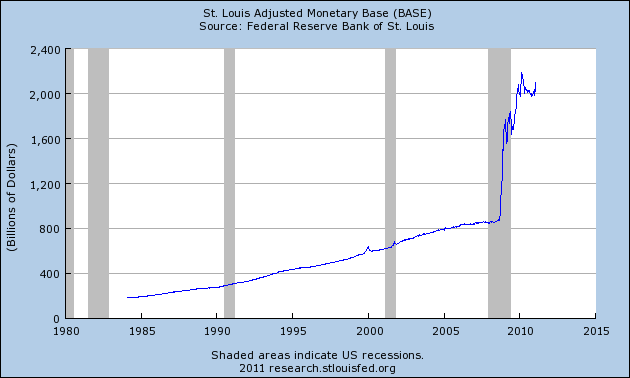
The charts tell the tale. There can be little doubt that the dollar is being debased. The graph below traces the growth of the monetary base, which consists of physical currency and Fed bank credit:
No doubt here. The supply of high-powered money has exploded.
But it is not only the monetary base that has expanded; take a look at M2, an aggregate of money and money substitutes:
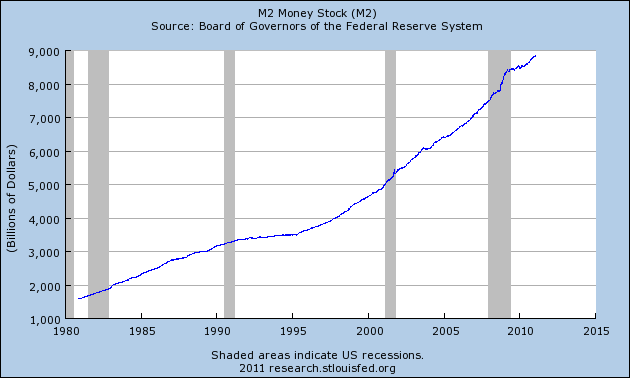
Since the recession began in December, 2007, the M2 money supply has increased by over 18%.
Next is the chart of the CRB Index, a group of 19 commodities used to track the overall price of raw materials:
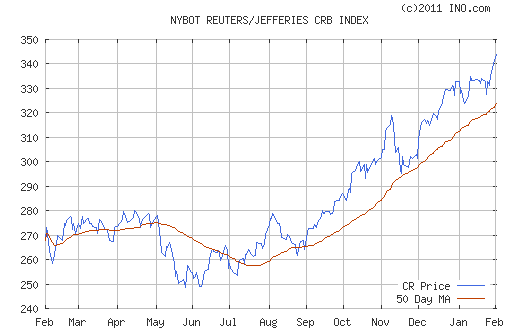
The index clearly shows a strong trend upward, suggesting a general loss of value by the USD.
Yet, for my money, the trajectory of gold prices is the best yardstick to measure that value of the dollar. Below is a ten-year chart of the dollar price of gold. It is self explanatory.
Now, let’s look at some charts of the US dollar vs. other fiat currencies.
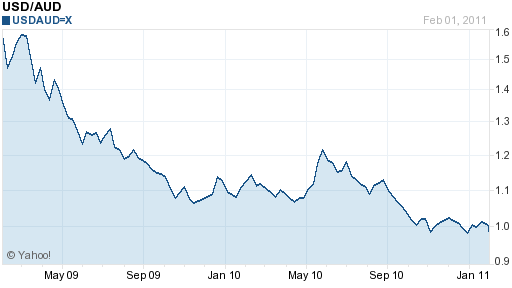
Here’s a two-year chart of the USD vs. the Australian dollar:
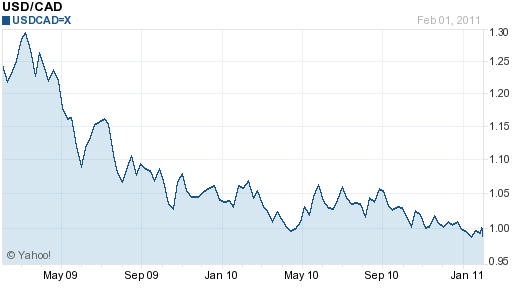
Here’s a two-year chart of the US dollar vs. the Canadian dollar:
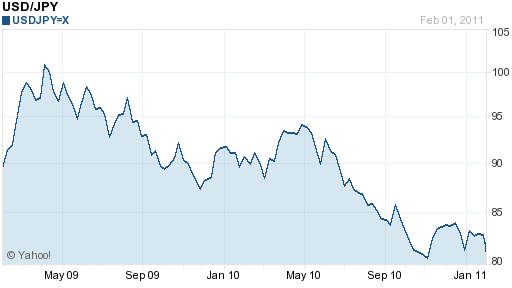
Finally, a two-year chart of the US dollar vs. the Japanese Yen:
Most dollar defenders point to the relative stability of the hallowed Dollar Index, but this only points to a deep flaw in that index; namely, it contains such a high percentage (58%) of the equally challenged euro that it vastly understates the dollar’s weakness.
In our recent “Kudlow Report” debate, Luskin claimed that rising commodity prices no longer provided good inflation signals, saying that “for the last decade or so, the canaries [commodity prices] that we’re using in this mine shaft just aren’t functioning right.”
I’m not sure why Luskin has decided to stop relying on market prices to determine the rate of inflation. Apparently, he now prefers dubious inflation metrics provided by the very government that creates the inflation. This is equivalent to trusting Enron’s bookkeepers over an independent audit. For a smart guy, such faith is surprising.
By contrast, US dollar-holders around the world are increasingly losing faith in our currency and our government. They are tiring of the Fed’s 26-month marathon of zero percent interest rates, and the Treasury’s ballooning balance sheet. They are fearful that their bonds cannot withstand the twin threats of devaluation and default. That’s why the dollar is losing its reserve currency status and inflation rates are rising. But hey, at least Luskin can keep the faith – I just hope he doesn’t mind being the only one.
Related Posts
Made in America: The Dark Forces Promoting American Manufacturing
 Whenever an election year rolls around, domestic manufacturing becomes a more central theme of discussion. Candidates from both sides, who seem to disagree on almost everything else, never waver in their commitment to auto manufacturers in Detroit and the steel industry. Republicans and Democrats never forget to remind the American public that they will try […]
If 10-Year Yields Surpass 5%, Say Hello to QE (and Massive Inflation)
 The wizards at the Fed and US Treasury have been forced to acknowledge that their “transitory,” inflation is, in fact, quite “sticky.” And with the inflation elephant now acknowledged by the circus of high finance, Treasury yields keep inching up, recently reaching 4.7% — the highest since November. The Fed is stuck: It needs to raise interest rates to tame inflation and […]
California’s New Minimum Wage: A Cure that Exacerbates the Sickness
 The solution to a problem shouldn’t make the problem worse. But apparently, California’s policy makers missed that memo. On April 1st, the state instituted a $20 minimum wage for fast food workers, the highest in the US. With California’s absurdly high cost of living, the policy appeared to make life more manageable for low-income residents. Unfortunately, as the adage goes, “If it sounds too […]
$5 Wrench Attack: Bitcoin vs Gold in a Real Collapse
 The monetary battle of the 20th century was gold vs. fiat. But the monetary battle of the 21st century will be gold vs. bitcoin. With Wall Street jumping into the game with bitcoin ETFs, a bitcoin halving recently splitting the block reward for miners in half, and both gold and bitcoin hovering near their all-time highs, it’s a great time for […]
How Nvidia Uses Gold
 What is Nvidia? If you’re a committed gamer the question may sound like nonsense. Nvidia, which was founded in 1993, is a tech company that makes GPUs and other products. It originally specialized in making products for the video game industry, that assisted in 3D rendering. If you were a committed gamer, you probably owned their products. If you weren’t, you might not have heard of them.
Leave a Reply