

Is this Really the Scariest Chart in the World?

True Economics called it “the scariest chart in the world.”
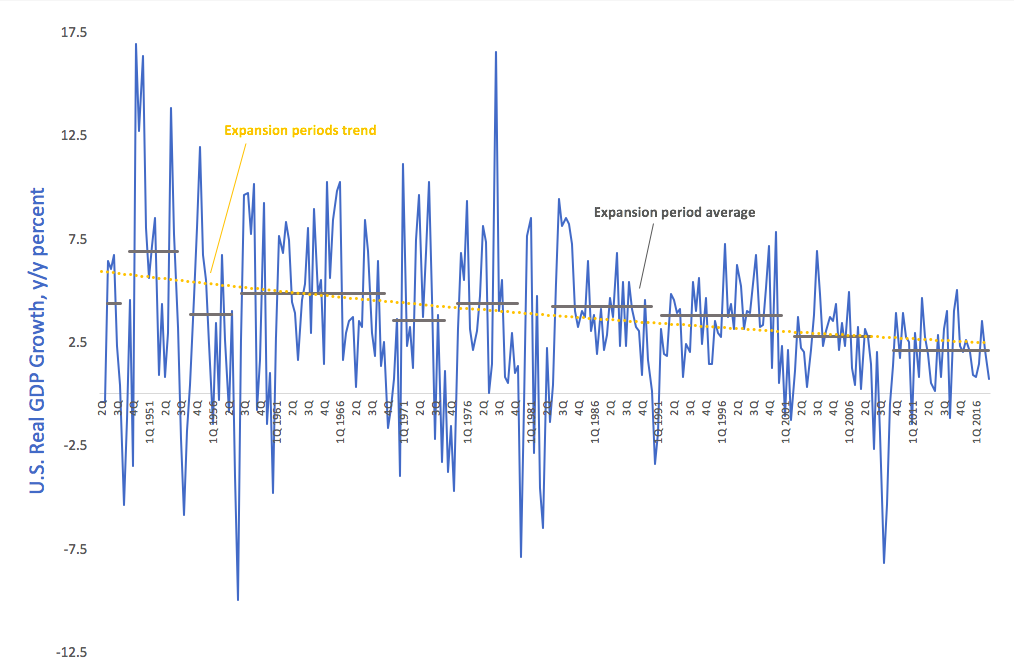
That may be a little bit of hyperbole, but a chart showing declining average rates of growth during each economic expansionary period since the 1950s is certainly cause for concern.
Almost non-existent economic growth in the US during the first quarter of 2017 didn’t seem to generate much hoopla in the mainstream media. Most analysts seem to think the tepid 7% growth rate was an outlier. In fact, the Atlanta Fed’s early forecast for Q2 growth is over 4%. As Peter Schiff pointed out in a recent podcast, this seems pretty crazy in light of the economic data. Nevertheless, it was enough to put a pause on Federal Reserve rate hikes – at least for the month of May.
But the weak growth number wasn’t really an outlier. Since the Great Recession of 2008, GDP growth has only averaged about 2%. The pre-recession rate was closer to 3%. In fact, the “recovery” has been weak to say the least.
This follows the trend revealed in the “scariest chart in the world.” After each successive recession since 1975, the recovery has been weaker. The trend (the yellow line) has drifted downward since the 1950s.
True Economics adds this bit of analysis.
Now, let me highlight that point: yellow line only considers periods of consistent growth (omitting official recessions, and one unofficial recession of 2001). So, no: the depth of the Great Recession has nothing to do with the yellow line direction. If anything, given the depth of the 2008-2009 crisis, the most current grey bar should have been at around 4%, almost double where it sits today.”
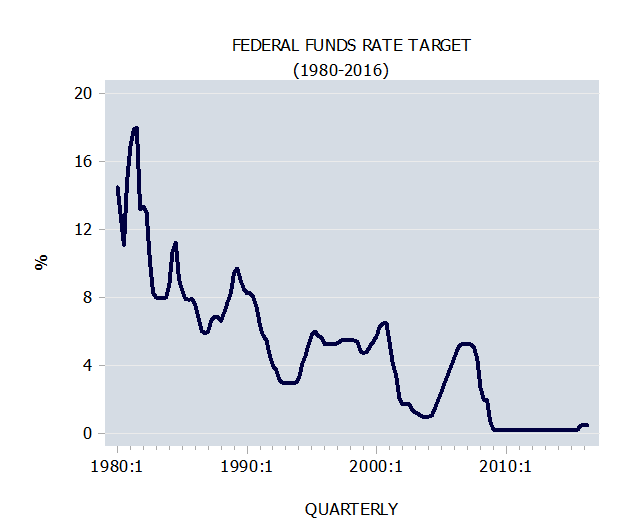
This represents a very disturbing trend in the business cycle. This could be a sign that the “tools” central bankers use to stoke the economy during a downturn – namely low interest rates and stimulus – are becoming less and less effective. In each successive recession, the Federal Reserve has had to push rates lower for longer periods. and the increase in interest rates post-recession have been slower and have peaked at a lower level. Consider that 9 years after the crash, the Fed still hasn’t gotten the interest rate above 1%.
You can see the steady downward trend of the Fed funds rate in the following chart.
So what will happen during the next big downturn? The Fed doesn’t have far to go. Will it turn to negative interest rates? Will it dump so-called helicopter money?
Central bank stimulus is a lot like heroin. The more the addict uses, the more drug it take to get the high. At some point, there is usually an overdose.

Get Peter Schiff’s latest gold market analysis – click here – for a free subscription to his exclusive weekly email updates.
Interested in learning how to buy gold and buy silver?
Call 1-888-GOLD-160 and speak with a Precious Metals Specialist today!
Related Posts
Will the World’s Most Pro-Bitcoin Politician Embrace Gold?
 Since Nayib Bukele became president of El Salvador, El Salvador has been in American media and global political discussion more than ever. While much of the attention focuses on Bukele’s mass incarceration of gang members and a decline in homicide of over 70%, Bukele has also drawn attention to his favoritism towards Bitcoin and how he […]
 With gold hitting yet another awe-inspiring all-time high in the wake of Powell’s remarks reassuring markets (more or less) to expect rate cuts in 2024, a few analysts are pointing out risk factors for a correction — so is there really still room to run?
Gold Hits New All-Time Record High
 Gold hit a new all-time nominal high, surpassing the previous record set in December of the previous year. The precious metal’s price reached approximately $2,140, indicating a robust and continuing interest in gold as a safe-haven asset, despite a rather peculiar lack of fanfare from the media and retail investors. This latest peak in gold […]
Is a Weak Yen Feeding the Global Gold Bull?
 The gold price has been surging, with unprecedented central bank demand gobbling up supply. It has been a force to behold — especially as US monetary policy has been relatively tight since 2022, and 10-year Treasury yields have rocketed up, which generally puts firm downward pressure on gold against USD.
 World Gold Council: “Blistering Central Bank Buying” Fuels Strong Gold Demand
 Total gold demand hit an all-time high in 2023, according to a recent report released by the World Gold Council. Last week, the World Gold Council (WGC) released its Gold Demand Trends report, which tracks developments in the demand for and use of gold around the world. Excluding over-the-counter (OTC) trade, 2023 gold demand fell slightly from 2022 […]