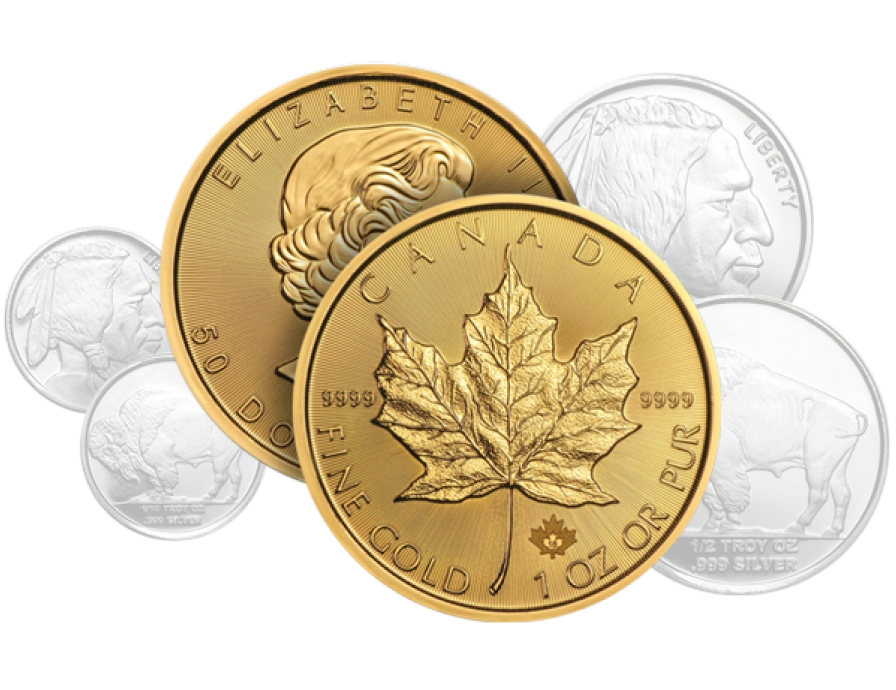
Contact us
CALL US NOW 1-888-GOLD-160
(1-888-465-3160)

2022 Trade Deficit Signals Inflation Closer to 15%

  by    0   0

The December Trade Deficit increased after a major drop in November. The total came in at $67B which was 10% greater than November’s $61B, but still well below the 6-month high from October of $77B. It is also below the $79B Trade Deficit from December 2021.

As shown below, the Trade Deficit has definitely come down quite a bit since the string of monthly deficits that all exceeded $80B from January to June of 2022.

Figure: 1 Monthly Plot Detail

The table below provides detail.

Monthly Trade Deficit

    • YoY Goods Exported increased 5.5% while Services Exported increased 12.2%
        • Imported Goods actually fell while Imported Services surged 14.4%
    • On a net basis, the Goods Deficit surged 8.9% MoM but fell 9.8% YoY
    • The Services Surplus grew MoM 4.7% and YoY 7.2%

Looking at Trailing Twelve Month:

    • The TTM Net Deficit increased from -$845B last year to -$948B for the TTM period ending Dec 2022
        • MoM the TTM Net Deficit fell from -$982B
    • The TTM Services Surplus fell by 0.6%
    • At an aggregate level, Exports/Imports and Goods/Services all increased by more than 15%!

Similar to the recent jobs report, the Trade Deficit might initially signal a strengthening economy where Exports are growing and Imports are falling. While the BLS Jobs numbers made little sense given the economic environment, the improving Trade Deficit could be explained by the fall in the dollar along with a rise in global inflation.

As the dollar falls in value, US exports become cheaper to the rest of the world. Similarly, Imports become more expensive. However, as shown below, the fact that all categories have surged by such an incredible margin (15%+) in a weakening economy suggests that fewer goods are being consumed for significantly more. Even if goods consumption remained flat in 2022 (very unlikely compared to 2021), then the Trade Deficit would indicate global inflation well into the double digits. Double-digit inflation seems like the most likely explanation for the large growth.

Figure: 2 Trade Balance Detail

Historical Perspective

Zooming out and focusing on the net numbers shows the longer-term trend. The massive Deficit spike in March was fully reversed, but it has now come back in line with the downward trend that had been ongoing before Covid.

Figure: 3 Historical Net Trade Balance

The chart below zooms in on the Services Surplus to show the wild ride it has been on in recent months. It compares Net Services to Total Exported Services to show relative size. After hovering near 35% since 2013, it dropped below 30% in July last year. It has rebounded to 28.3% in the latest month, up from 24.6%, which is another factor helping reduce the Trade Deficit.

Figure: 4 Historical Services Surplus

To put it all together and remove some of the noise, the next plot below shows the Trailing Twelve Month (TTM) values for each month (i.e., each period represents the summation of the previous 12 months).

Figure: 5 Trailing 12 Months (TTM)

Although the TTM Net Trade Deficit is near historical highs, it can be put in perspective by comparing the value to US GDP. As the chart below shows, the current records are still below the 2006 highs before the Great Financial Crisis.

The current 3.63% is moving back down but is still well above the 2.5% from before Covid.

Figure: 6 TTM vs GDP

The chart below shows the YTD values. Because the latest month is December, these are full-year figures. 2022 is well above prior years by a significant margin. As mentioned above, most or even all of this increase could be directly tied to the global rise in inflation.

Figure: 7 Year to Date

What it means for Gold and Silver

The Trade Deficit represents how much paper the US is trading for physical goods. The Deficit sits near all-time highs, which means the US dollar continues to be sent abroad in record amounts. The Trade Deficit has improved in recent months, but this is likely more due to the falling dollar and less from a burgeoning US economy.

The current weak economy suggests that goods consumption was probably flat or down, people are just paying more for everything. 15% more! A falling dollar with higher inflation is a world where gold will offer the best protection.

Data Source: https://fred.stlouisfed.org/series/BOPGSTB

Data Updated: Monthly on one month lag

Last Updated: Feb 07, 2023, for Dec 2022

US Debt interactive charts and graphs can always be found on the Exploring Finance dashboard: https://exploringfinance.shinyapps.io/USDebt/

Download SchiffGold's Free Silver Report

Get Peter Schiff’s key gold headlines in your inbox every week – click here – for a free subscription to his exclusive weekly email updates.
Interested in learning how to buy gold and buy silver?
Call 1-888-GOLD-160 and speak with a Precious Metals Specialist today!

Related Posts

The Technicals: Something Else is Driving Gold

This analysis attempts to look at different metrics to understand the current momentum in the gold and silver markets. It is meant as an analysis of potential price direction in the very short term (1-2 weeks).

READ MORE →

Is the Comex Showing an Impending Price Spike in Silver?

The Comex report last month showed a lot of strength in gold which directly preceded a massive up move for the price of gold. The data is looking similar in silver this month!

READ MORE →

Money Supply Sees Major Jump in Recent Weeks

Money Supply is a very important indicator. It helps show how tight or loose current monetary conditions are regardless of what the Fed is doing with interest rates. Even if the Fed is tight, if Money Supply is increasing, it has an inflationary effect.

READ MORE →

Jobs: Household Report Jumps but QCEW Shows Job Market is Not as Strong

The analysis below covers the Employment picture released on the first Friday of every month. While most of the attention goes to the headline number, it can be helpful to look at the details, revisions, and other reports to get a better gauge of what is really going on.

READ MORE →

Yellen Continues Betting on Interest Rate Declines

In February, the data showed that Yellen was making a big bet that long-term rates would not stay elevated for long. This was demonstrated by the volume of short-term debt issuance. The Treasury was willing to pay higher rates to keep the maturity of the debt shorter.

READ MORE →

Comments are closed.

Call Now